
Many micro-controller projects use lithium ion (li-ion) batteries and we needs a simple way to display the state of charge (SoC) which is how much battery we have left. This is typically displayed on the screen as a partially filled battery icon and optionally a percentage indicator next to it.
There are however several challenges we need to address to be able to display reasonably accurate information on the screen. We will focus on the three primary items below which does the job with very little effort.
- How o we measure the battery level?
- How does the batteries characteristics taken into account?
- How do we quickly draw this visually without having to worry about bitmaps that can be slow and harder to work with?
Measuring Battery Level
Measuring of the battery level can be accomplished by by using one of the micro-controllers input ports set up as an analog to digital converter (ADC). The main thing is to account for max voltage on the input pins compared to your batteries max voltage. For example, most li-ion batteries produce around 4.2 volts when they are fully charged so connecting them to a 3.3 volt operated micro-controller input pin will either burn out the pin or the input will read it the same level so you will not be able to see the difference between 4.2V and 3.3V.
The solution is to use two resistor as voltage dividers to reduce the voltage slightly so the maximum voltage to the pin is 0.75X of the micro-controllers rating. So say we we have a Li-on battery at 4.2V and running a ESP32 micro-controller at 3.3V, we want the maximum voltage to the Analog Input pin to be: 3.3V x 0.75 = 2.5 Volts
Using ohms law and this example calculator, we find out the values we need for the two resistors we need as shown:

So all we need to do is connect our Li-Ion battery to the 2 resistors and feed the divided voltage to the input pin of our micro-controller and we will be within safe specs of the ESP32 and we will get much more accurate readings, especially on the higher end.
For the lower end, we need to know approximately the minimum voltage the micro-controller will still operate before it just gives up and shuts down. Looking at the ESP32s data sheet for operating range it says it can operate with minimum source voltage of 2.3 volts.
At this low end right before they system gives up, what is the voltage applied to our input pin through our divider? Using the same formula above we get 1.37 volts.
So what will the ESP 32 input pin measure when it sees 2.5V on the high end and 1.37V on the low end? This can vary depending on how many bits the ADC of the micro-controller has. The ESP32 has 12-bit ADCs which means it can report 4096 different levels on the ADC pin. If you assume 4096 = 3.3V and 0 is 0V, this means our range of 1.37 to 2.5v should give us values between 1700 and 3100. In practice, its not 1:1 like this as the ADC performs differently in higher and lower ends and amount of load on battery can effect it, so you may need to measure the full charge level for your project. For now we can use these and I will show you how to adjust for load later in the article. This brings the next challenge as follows.
Li-ion batteries do not discharge linearly!
We need to understand how a Li-Ion batteries discharge over time because if we simply take the voltage we measure and show it as a percentage between low and high range, we will not get correct results because the discharge curve for Li-Ion batteries are not linear. Instead the they typically look something like below.

Between full charge (V full) say 4.2V and (V exp) ~3.3v, the discharge rate is rapid. For majority of the operating time, the discharge rate is very low. this is the mid section of the graph above. The higher the battery capacity, the longer this middle cycle is. Finally, when the voltage reaches (Vnom), the discharge rate picks up quickly. If we do not account for this you will see some ugly results on your display.
For example, lets say you have a 500mah battery that lasts about 4 hours in your project and our battery reading range was 3100 at full and 1700 right before it would shut down as described previously:
- First 30 minutes you would see the battery go down from 100% to 80% (readings of 3100 to 2820 )
- Next 3 hours you would see it go from 80% to 60% (reading of 2820 to 2540)
- Then, you would see it drop from from 60% to 0 in last 30 minutes! (reading of 2540 to 1700)
How did I go from 60% to 0 so fast? Sounds familiar
We can give users a much better experience and account for this in our project by treating each of these 3 phases differently. We can normalize these phases by
- Mapping the first phase which was originally 100 to 80%, to be instead 100 to 90%.
- Mapping the second phase which was originally 80 to 60%, to be instead 90%-10%.
- Mapping the last phase which was originally 60 to 0%, to be instead 10%-0%.
This is how it would look like in code:
value = analogRead(GPIO_NUM_36);
if (value >= 3100) bat_percent = 100;
else if (value >= 2820) // 90-100% range
bat_percent = map(value, 2820, 3100, 90, 100);
else if (value >= 2540) // 10-90% range
bat_percent = map(value, 2540, 2820, 10, 90);
else if (value >= 1700) // 0-10% range
bat_percent = map(value, 1700, 2540, 0, 10);
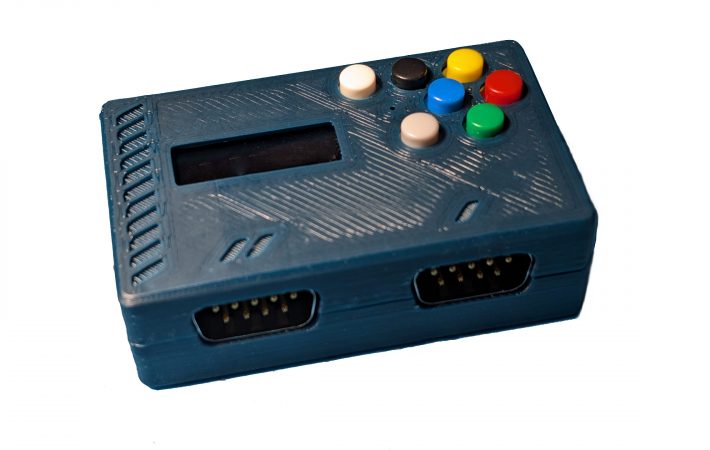
else bat_percent = 0;So I tested this in a test project where I used a small screen with an ESP32 connected to a 500mah Li-Ion battery.

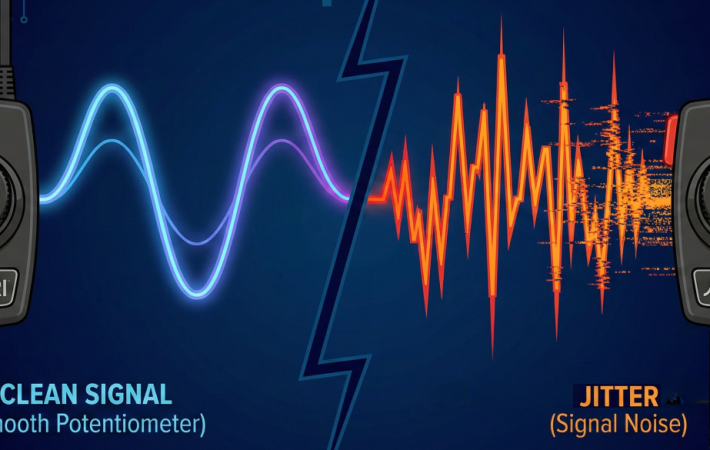
Remember I mentioned earlier that load of projects can effect the range I used above which was 3100-1700. So I fully charged the battery and connected to the ESP32 to capture battery levels and saw the high was almost 2700 and they lows before my battery died was 1700 . I decided to graph my batteries discharge curve by checking voltage every second and sending the values via Bluetooth communication to my PC where I could graph the discharge curve using raw levels and the mapped percentages based on adjustments I made. Here are the results:

You can see the true discharge curve in blue and how the modified code below transformed it to the orange much linear percentage over time.
    value = analogRead(GPIO_NUM_36);

    if (value >= 2650) bat_percent = 100;
    else if (value >= 2500)    // 85-100% range
      bat_percent = map(value, 2500, 2650, 85, 100);
    else if (value >= 2100)    // 10-85% range
      bat_percent = map(value, 2100, 2500, 10, 85);
    else if (value >= 1700)    // 0-10% range
      bat_percent = map(value, 1700, 2100, 0, 10);
    else bat_percent = 0;
Drawing the Battery Indicator
Instead of messing with loading bitmaps which can we a bid difficult to deal with, I found it much easier to just draw 3 of rectangles as follows:

You can then easily update the last filled rectangle with the current percentage adjusted for size of the rectangle. For example if the rectangle is 20 in width, you would just divide your battery percentage by 5 to get the width of the filled rectangle. This is what it looks like on my sample project. You can tell I missed the thickness of my first rectangle

Good luck and make sure to leave comments and questions!

Leave a comment
Your email address will not be published. Required fields are marked *